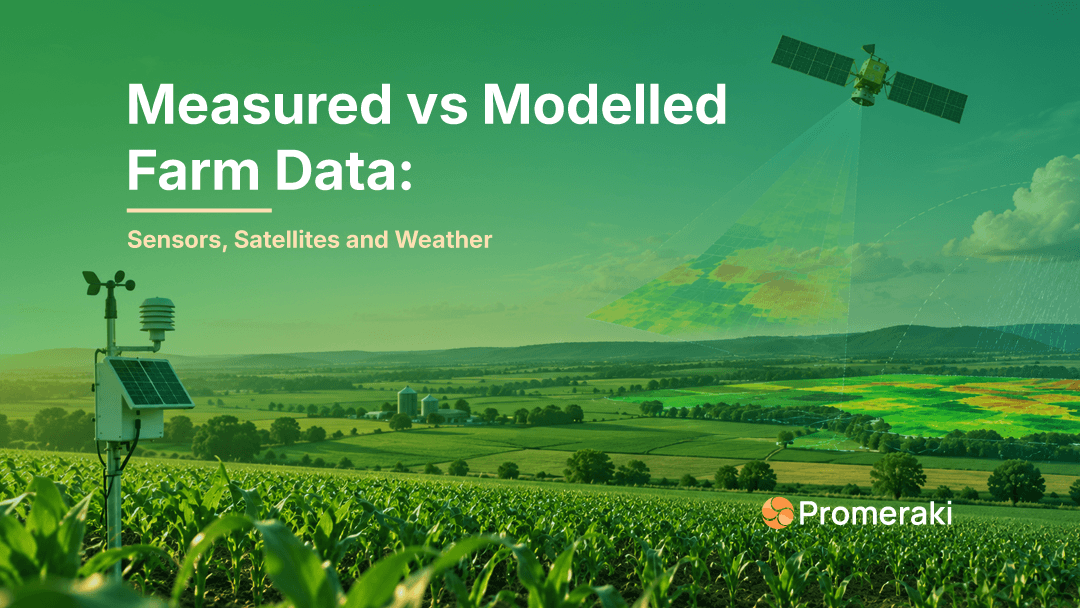
A soil sensor says the ground is getting dry.
Satellite data shows most of the field still looks healthy.
A weather service shows rain is expected in two days.
So, which data should you trust?
All three can be useful. They are simply looking at the farm in different ways.
Modern agriculture increasingly brings together ground sensors, satellite observations, weather stations, forecasts, and modelled data. The challenge is not collecting more numbers. It is understanding what each number represents and how much confidence to place in it.
A sensor measures conditions at one place. A satellite sees a much larger area. A weather model estimates conditions across a grid. None gives the complete picture on its own.
This is where measured and modelled farm data need to work together.
Why One Data Source Rarely Tells the Whole Story
A field may look uniform from the road, but conditions within it can vary.
One area may have heavier soil. Another may drain faster. One section may have received more rain. Crop growth may also differ across the same field.
A single sensor cannot capture all of that.
Satellite data adds a wider view. Weather data helps explain what has happened around the field. Forecasts provide information about what may happen next.
Together, these sources provide more context.
The important part is knowing where each value came from.
What Is Measured Data in Agriculture?
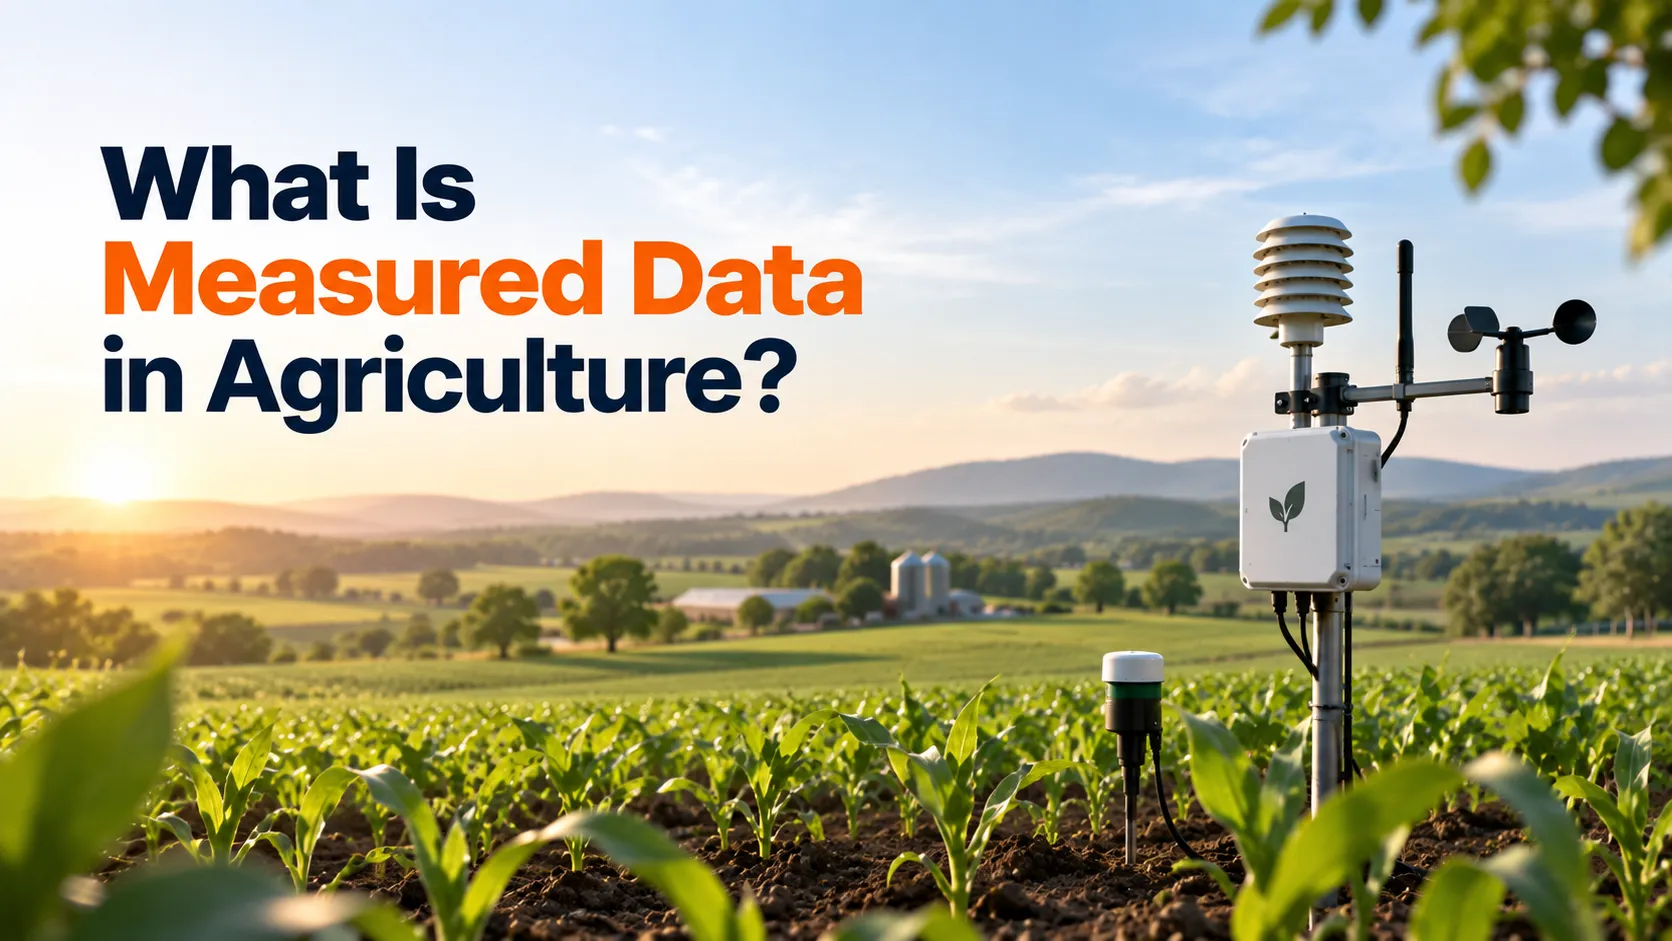
Measured data comes directly from an instrument observing a condition.
Examples include:
• A soil moisture probe measuring moisture at a certain depth
• A rain gauge recording rainfall
• A weather station measuring temperature and humidity
• A flow meter recording water movement
• A pressure sensor measuring irrigation pressure
• A leaf wetness sensor measuring moisture on the crop surface
Suppose a soil moisture sensor reports 24% volumetric water content at 8:00 a.m.
That is measured data.
But there is an important detail.
It represents the conditions around that sensor and at the depth where the measurement was taken. It does not automatically mean the entire field has 24% soil moisture.
Sensor placement matters.
So do soil type, installation depth, calibration, maintenance, and local field conditions.
Measured data gives you a direct observation. It does not give you a complete picture of every part of the farm.
What Is Modelled Data in Agriculture?
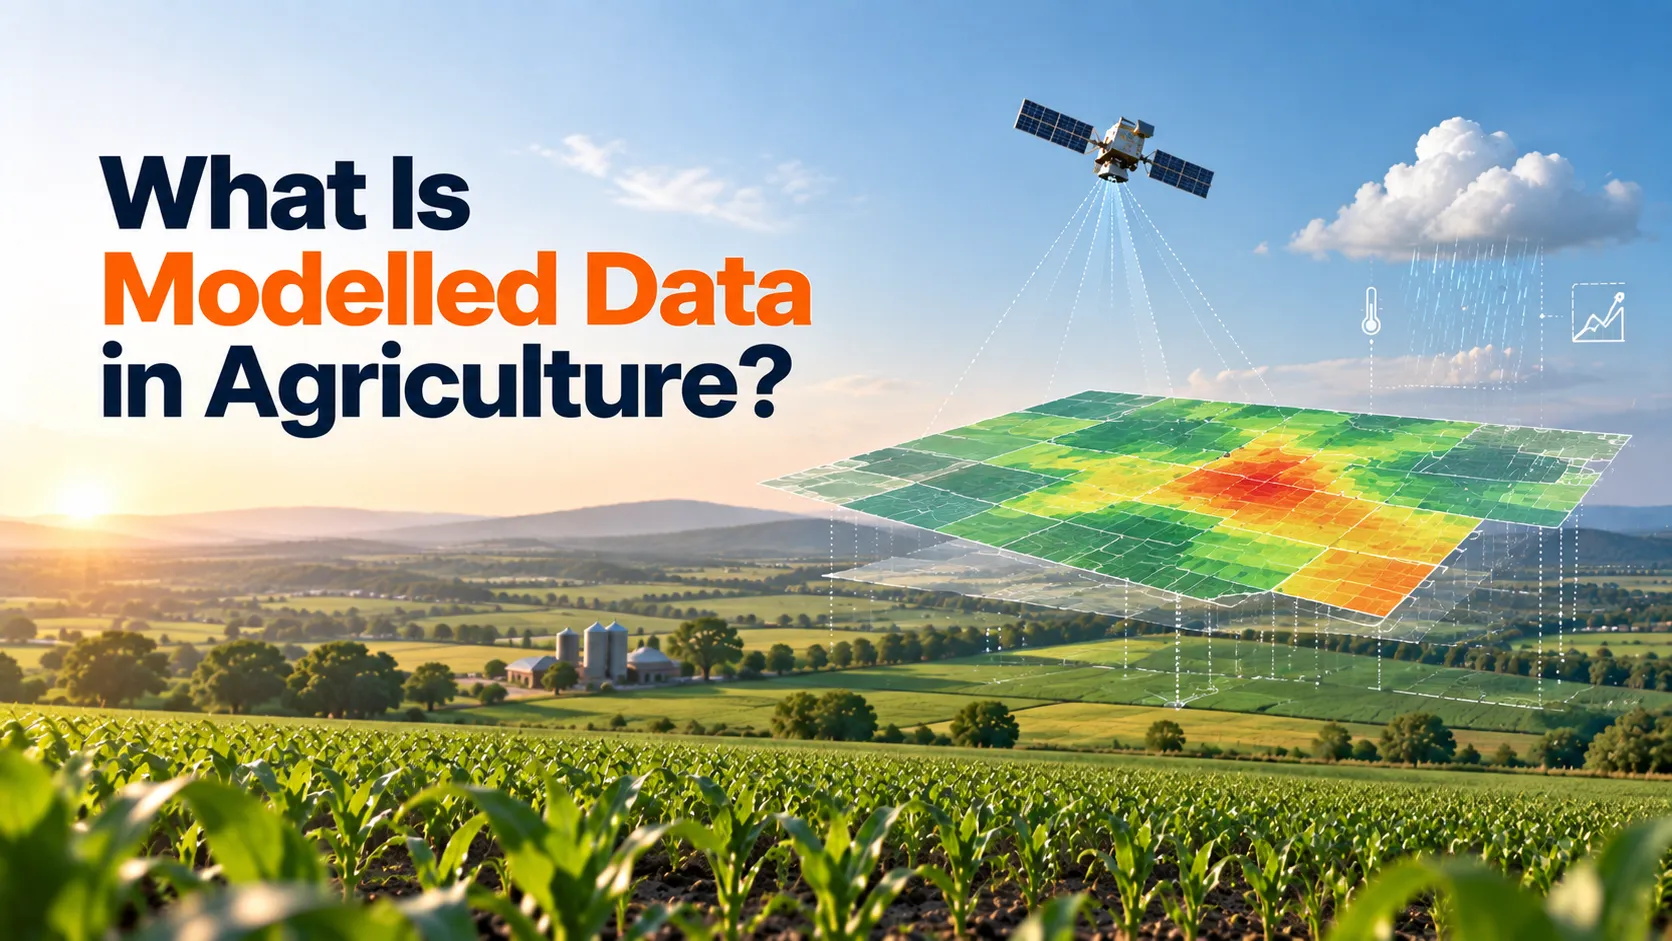
Modelled data is estimated using other information.
A model may use:
• Previous measurements
• Weather observations
• Weather forecasts
• Satellite observations
• Soil properties
• Crop information
• Historical data
• Mathematical or physical rules
Weather forecasts are an everyday example.
A farm weather station measures the temperature now.
A weather model estimates what the temperature, rainfall, humidity, and wind may be tomorrow.
The first value was observed directly at the station. The second was calculated using a forecasting model.
Modelled agricultural data is useful because direct measurements are not available everywhere or all the time.
But a modelled value should not be presented as though a sensor physically measured it in that field.
Is Satellite Data Measured or Modelled?
This is where the difference becomes less obvious.
A satellite instrument makes real measurements. Depending on the satellite, it may observe reflected light, thermal radiation, or microwave signals.
But many agricultural products created from satellite observations are derived.
Algorithms turn the original satellite observations into useful information such as:
• Vegetation indices
• Soil moisture estimates
• Crop condition indicators
• Surface temperature
• Leaf area information
• Water-related indicators
Some products go further and combine satellite observations with models.
So, satellite data does not always mean one thing.
When displaying it in an agriculture platform, it helps to identify whether the value is a direct satellite observation, a derived product, or an output that combines satellite data with a model.
Ground Sensors vs Satellite Data: Point Measurement vs Wider View
Ground sensors provide detail at a specific place.
Take a soil moisture probe.
It may record conditions every few minutes and show exactly how moisture changes after irrigation, rainfall, or a hot afternoon.
That frequency is useful.
But there is a trade-off. The sensor represents only a small part of the field.
Satellite data provides a different type of visibility.
It helps identify patterns across fields, farms, and larger regions.
For example, ISRO announced in February 2026 that NISAR data is being used to generate soil moisture products at 100 metre resolution across India. The planned operational products provide two observations every 12 days and are intended to support uses including irrigation planning, drought preparedness, and agricultural advisories.
Other satellite systems provide different types of agricultural information. ESA's Sentinel-2 mission, for example, provides imagery at resolutions of 10, 20, and 60 metres depending on the spectral band. ESA states that the two-satellite constellation has a five-day revisit time at the equator.
This shows the basic difference clearly.
A ground sensor gives a detailed reading from one location.
Satellite data helps reveal how conditions differ across a wider area.
They solve different parts of the same problem.
How Weather Data Adds Context to Sensor Readings
A sensor reading becomes more useful when you understand what happened around it.
Suppose soil moisture falls faster than expected.
The reading alone tells you moisture has changed.
Weather data may help explain why.
Was the temperature higher?
Has there been no rain?
Was the wind stronger?
Did humidity drop?
Weather information provides context for what ground sensors see.
Historical weather helps explain recent changes. Forecast data helps with planning.
But forecast data also needs to be interpreted correctly.
ECMWF explains that numerical weather prediction grid values should not be treated as the exact weather at a single location. They represent a time and space average across a grid box. Small local variations may not be fully represented.
This distinction matters in agriculture.
If a weather model forecasts 15 mm of rain for the area, that does not mean a rain gauge in every field will record exactly 15 mm.
Measured rainfall and forecast rainfall should remain clearly separated.
What AgTech Companies Should Consider When Combining Farm Data
For agriculture technology companies and equipment manufacturers, connecting multiple data sources is only the first step.
The platform also needs to preserve their meaning.
Always Keep the Data Source
Users should know whether a value came from a sensor, weather station, satellite product, or model.
Do not remove the source once the information reaches the dashboard.
Keep Time Visible
Freshness matters.
A sensor reading from five minutes ago and a satellite observation from four days ago should not appear equally current.
Understand Spatial Scale
This is one of the biggest differences between agricultural datasets.
A point sensor and a weather grid are not observing the same area.
The platform should account for that when comparing or combining values.
Handle Data Quality Clearly
Sensors fail.
Readings can become stale.
Third-party feeds can stop.
Models carry uncertainty.
The system should identify missing, old, or unreliable data rather than silently treating every value as valid.
Avoid Creating One Magic Number
Combining data does not always mean averaging everything into one score.
Sometimes it is more useful to show several related signals together.
For example:
Sensor moisture: Low
Satellite field pattern: Normal
Rain last 48 hours: None
Rain forecast next 48 hours: 20 mm
The user gets the context needed to make a decision without losing the meaning of the original data.
Measured and Modelled Farm Data Work Better Together
Measured data tells you what an instrument observed.
Satellite data adds a wider view.
Weather data explains surrounding conditions.
Modelled data helps estimate what cannot be directly measured everywhere and provides a view of what may happen next.
Each has strengths.
Each also has limits.
The goal is not to choose sensors over satellites or measured data over models.
It is to use each source for the job it does best.
For AgTech companies, this means building platforms that keep the source, time, location, scale, and quality of agricultural data clear.
When those pieces come together, users get more than another dashboard.
They get a clearer picture of what is happening in the field and better context for deciding what to do next.
Promeraki helps agriculture technology companies and equipment manufacturers build IoT platforms that bring field sensor data, satellite-derived information, weather services, third-party APIs, and operational data into one place.
If your agricultural product collects data from several sources, talk to our team about turning those feeds into a platform your customers can understand and use.