Have you ever noticed that two rows sitting right next to each other in the same vineyard can produce completely different results at harvest time?
Same grapes. Same water. Same care. Yet one row ripens perfectly while the other is either behind or already past its peak.
It's confusing and honestly a little frustrating. But there's a real reason behind it. And it has nothing to do with how well you're managing your vineyard.
It comes down to microclimates.
Every vineyard has them. Most growers know they exist. But very few know what's happening across their land row by row, and that's where a lot of quality and consistency gets lost.
In this blog, we're going to break down exactly what microclimates are, why they cause such big differences even within a single vineyard, and how microclimate mapping is helping modern growers finally get a clear picture of what's going on.
What is a Vineyard Microclimate?
Let's keep this simple.
When you hear someone talk about a wine region's climate, like the warm, dry summers of Napa or the cool Atlantic influence in Bordeaux, they're talking about the big picture climate. The broad regional conditions that shape an entire growing area.
Then there's a vineyard-level climate with the conditions specific to your estate. The hill you're on, the valley nearby, and how close you are to a water body. This is what gives individual properties their character.
But then there's something even smaller. Something is happening right inside your vineyard, between your rows, and that's the microclimate.
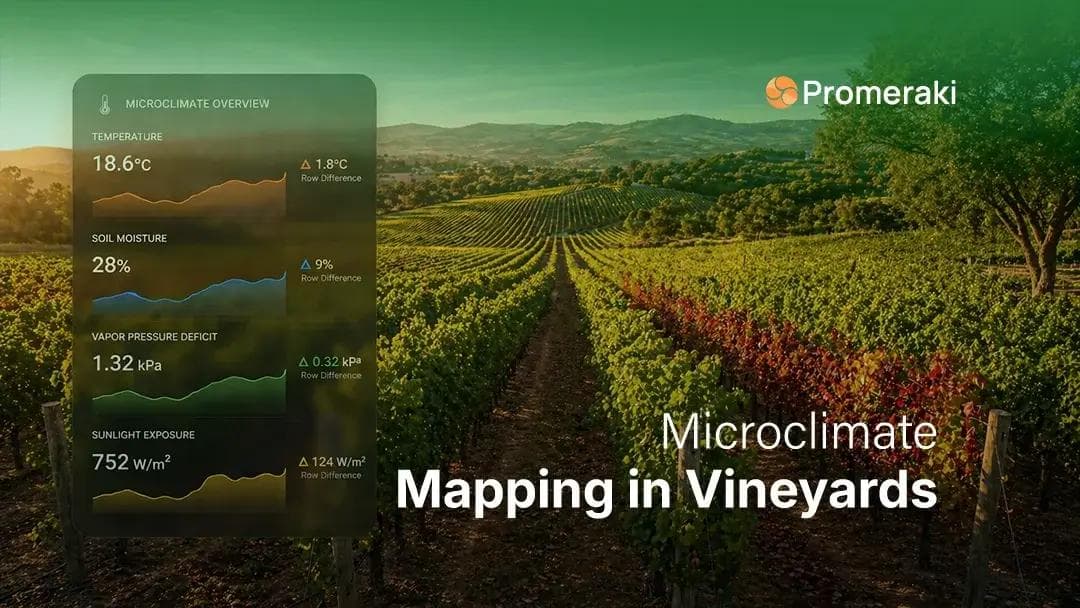
A microclimate is simply the set of environmental conditions in a very small, specific area. In a vineyard, it means the temperature, humidity, airflow, sunlight, and soil moisture that one row or section experiences, which can be noticeably different from the row just a few feet away.
The main things that make up a microclimate are:
- Temperature: how warm or cool it gets at vine level
- Humidity: how much moisture is floating around the canopy
- Wind: how much airflow moves through the row
- Sunlight: how much direct light reaches the vines and fruit
- Soil moisture: how much water is available to the roots
Now here's the thing that surprises most people: a difference of just 1 to 2 degrees Celsius between two rows can mean several days' difference in ripening. It can mean one row stays clean all season while the other battles disease. Small difference, huge impact.
Why Two Rows in the Same Vineyard Behave So Differently
This is the part most growers want to understand. So, let's walk through the real reasons.
The direction your rows run matters more than you think. Rows running north to south get sunlight on both sides at different points during the day, which means even more heat and light distribution. East-west rows tend to have one side in sun and one in shade for most of the day. That imbalance affects how the canopy heats up and how evenly grapes ripen.
Even a small slope can change everything. Cold air is heavier than warm air. It moves downhill and settles in the lowest spots. So, a row sitting in even a slight dip can collect cold air overnight, making it more vulnerable to frost and slower to warm up in the morning. The row just a few meters uphill can be a completely different situation.
Your soilisn't the same everywhere even if it looks like it is. Within a single vineyard block, soil can shift fromsand to clay within just a few rows. Sandy soil drains fast and warms up quickly. Clay holds onto water and stays cooler. That directly changes how vines take up water, how stressed they get, and when they decide to ripen.
A thick, bushy canopy creates its own little weather system. Dense canopy = trapped humidity, poor airflow, shaded fruit. That's the perfect setup for disease. An open canopy lets air move through, sunlight reach the bunches, and moisture dry off quickly after rain. Two rows with different canopy management can feel like two completely different environments.
Trees, fences, and windbreaks protect some rows but not always ina good way. Shelter fromthe wind sounds like a good thing. But it also means less airflow, which means humidity stays higher and things dry out more slowly after rain. Rows tucked close to a windbreak to behave differently from rows in an open area of the same block.
Which way your slope faces changes how much heat itcollects. In the northern hemisphere, a south-facing slope gets more direct sunlight and accumulates more heatthroughout the season. A north-facing row in the same vineyard can be noticeably cooler and significantly later ripen almost like it's in a different growing region altogether.
Think of it this way: in a restaurant, the table by the sunny window is always warmer than the one near the air conditioning, even though they're in the same room. Your vineyard rows work the same way. Same vineyard, different experience.
What Is Microclimate Mapping and How Does It Work?
Microclimate mapping is simply the process of collecting environmental data across your vineyard and building a clear picture of how conditions vary from row to row and block to block.
The goal is to replace guesswork with actual knowledge. To know, not assume, what's happening at the vine level across your land.
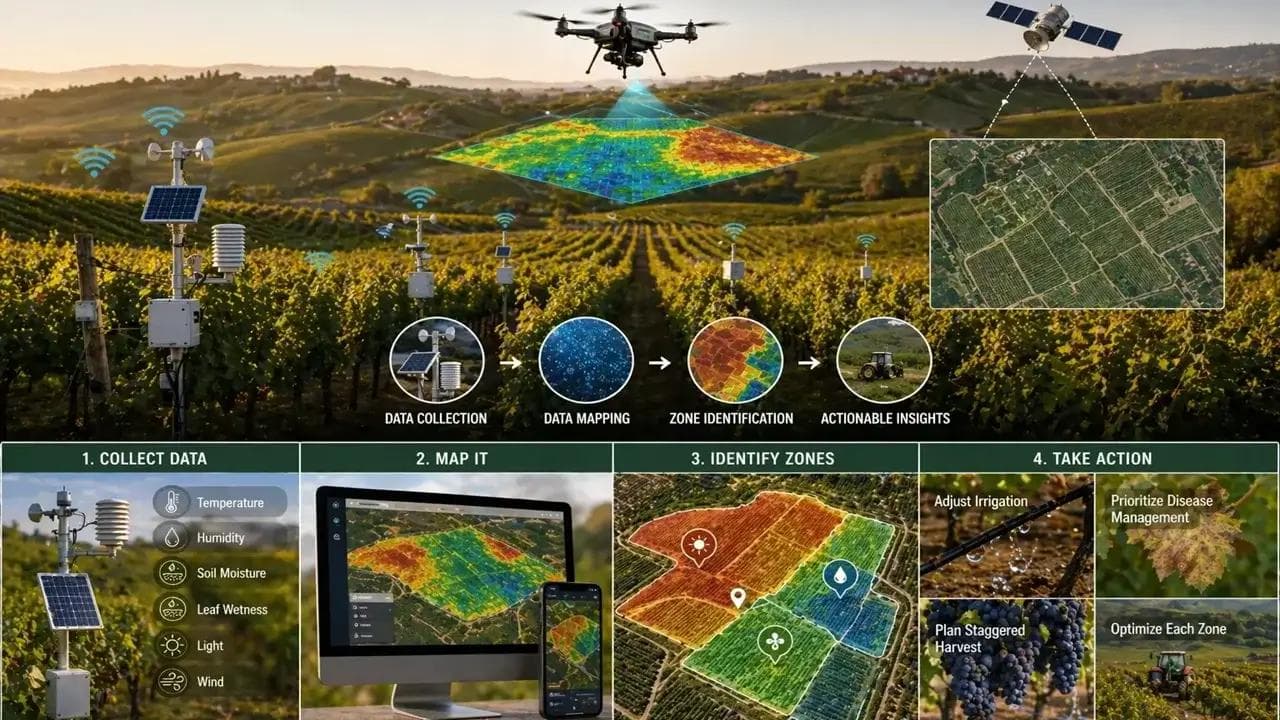
Here's how it works in practice:
First, you collect data. Sensors go across the vineyard at canopy height and at root depth. They continuously record temperature, humidity, soil moisture, leaf wetness, light levels, and wind. Drone imagery and satellite data can also be layered in.
Then you map it. All that sensor data gets overlaid onto a digital map of your vineyard. You can see, visually, how conditions shift from one row to the next. It goes from numbers on a screen to a map you can actually look at and understand.
Then you identify zones. Patterns start to appear. Certain areas consistently run warmer. Others hold humidity. Some sections dry out faster. Your vineyard naturally divides itself into distinct zones not based on assumption, but on what the data is showing.
Then you act on it. This is where the value really shows up. Each zone gets managed based on its actual conditions. Irrigation adjusted. Disease management is prioritized where humidity is highest. Harvest is planned in stages as different zones hit peak ripeness at different times.
The technology involved IoT sensors, weather stations, drone mapping, and a connected platform sounds complicated. But the right setup makes all this readable and usable even for teams who aren't data experts.
Where IoT Sensors Come In
Here's the honest limitation of traditional vineyard scouting: it gives you a snapshot.
A good viticulturist walking the rows picks up a lot. Visual stress signs, soil feel, berry samples. That knowledge is irreplaceable. But microclimates operate 24 hours a day through the night, during rain events, and during that cold snap at 3am that nobody was around to notice. Manual observation can't capture that level of continuous, across-the-board data.
That's exactly where IoT sensors change things.
Wireless sensors placed across the vineyard monitor conditions around the clock, every day of the growing season. No gaps. No missed events. Readings every 15 to 30 minutes are automatically sent to a central platform where the data is visualized and easy to read.
What they track:
- Air temperature at vine level
- Humidity around the canopy
- Leaf wetness a key indicator for disease risk
- Soil moisture at different depths
- Solar radiation, actual light reaching the vines
- Wind speed and direction
The real power isn't just the data; it's the density of it. When sensors are spread across your blocks, you're not looking at one averaged reading for the whole vineyard. You're seeing exactly how conditions vary row by row.
And you can set alerts. Get notified when humidity in a specific zone crosses the threshold where disease risk climbs. The platform monitors; you decide what to do.
That shift from reacting to problems after they've started catching the conditions that create them before they do is where growers really start to feel the difference.
What You Actually Gain from Microclimate Mapping
Let's make this practical. Here's what mapping your vineyard's microclimates delivers:
You pick at the right time for each zone. Different zones ripen at different rates. When you know which blocks are ahead, you can harvest in stages, picking each section at its actual peak instead of making one compromised decision for the whole vineyard.
You catch disease before it spreads. Knowing which rows consistently hold humidity means you can target fungicide applications where they're genuinely needed, well before conditions become critical. Less spraying overall, better protection where it matters.
Your water is smarter. Some rows need more water. Some need less. Without spatial data, most growers end up overwatering some areas and underwatering others on the same schedule. Microclimate mapping fixes that.
Your input costs go down. When every resource, water, treatments, and labor are applied based on real zone-level need rather than vineyard-wide averages, waste drops. You're spending time where it actually makes a difference.
Your grape quality becomes more consistent. Zone-specific management means every part of the vineyard gets what it actually needs. That shows up in the fruit year after year.
You build knowledge that lasts. Multi-season data reveals long-term patterns, which varieties perform best in which zones, where replanting makes sense, and whether a particular block would benefit from a different trellis system. That's the kind of information that makes every future season smarter than the last.
Summary
- Microclimate mapping reveals why vineyard rows ripen differently, helping growers improve irrigation, disease control, harvest timing, and consistency.
A Few Challenges Worth Knowing About
It's only fair to be honest about the challenges, too.
The upfront cost is real. Deploying sensors at meaningful density across a large vineyard takes investment. Costs have come down, but it still needs planning, especially smaller operations.
More data isn't always better without the right platform. Sensors generate a lot of reading. If the platform doesn't present that data clearly, it becomes noisy instead of insight, and people stop using it.
You need context to act on the data. Sensor readings don't make decisions for you. They need someone with agronomic knowledge or a technology partner who understands both the tech and the crops to translate numbers into real actions.
Microclimates change. A new windbreak, a different pruning approach, and an unusually wet spring. These things shift your microclimate patterns. Mapping is an ongoing practice. One season of data is a starting point, not a final answer.
None of these are reasons to avoid microclimate mapping. They're just things to plan for, especially when choosing the right partner to build and manage the infrastructure.
Conclusion
Go back to where we started, two rows, side by side, in the same vineyard, behaving like they're in completely different places.
Now you know why. Row orientation. Slope. Soil. Canopy. Wind. Aspect. These aren't random variables you can't control. They're measurable, mappable conditions that you can understand and respond to with the right data.
Microclimate mapping turns the invisible into something visible. It gives vineyard managers something they've never really had before a clear, continuous, spatial picture of what their land is actually experiencing, row by row, day by day.
You don't need a research budget or a data science team to get started. IoT sensors have made this accessible. The right platform makes the data usable. And the right partner makes the whole thing work without adding complexity to your operations.
The grapes in every row of your vineyard are responding to conditions you may not even know are there. Microclimate mapping means you finally get to know your vineyard the way it's always known in detail, in real time, and with nothing hidden.
That's not just a better viticulture. That's the foundation of consistently better wine.
Looking to bring real-time microclimate monitoring into your vineyard operations? Discover how Promeraki's IoT platform engineering helps agricultural teams connect their land, collect meaningful data, and make smarter decisions every season.
What is a Vineyard Microclimate?
Turn row-level vineyard data into clearer irrigation, disease, and harvest decisions with real-time microclimate monitoring.