A solar plant can look perfectly fine and still lose money.
Solar panels degrade slowly. Inverters drift below peak efficiency. Dust builds on the glass. Grid export drops without any clear reason. Without the right data, operators will miss all of this. They only find out when the revenue report arrives.
That's why Solar PV Plant KPIs matter.
KPIs give operators a clear, real-time view of how a plant is actually performing. They catch problems early. They reduce O&M costs. And they protect energy output throughout the plant's life.
This guide covers 12 key solar plant KPIs every operator should track. Whether you manage a rooftop photovoltaic power station, a ground-mounted site, or a large utility-scale facility, these metrics are the foundation of effective solar asset management.
What are Solar PV Plant KPIs?
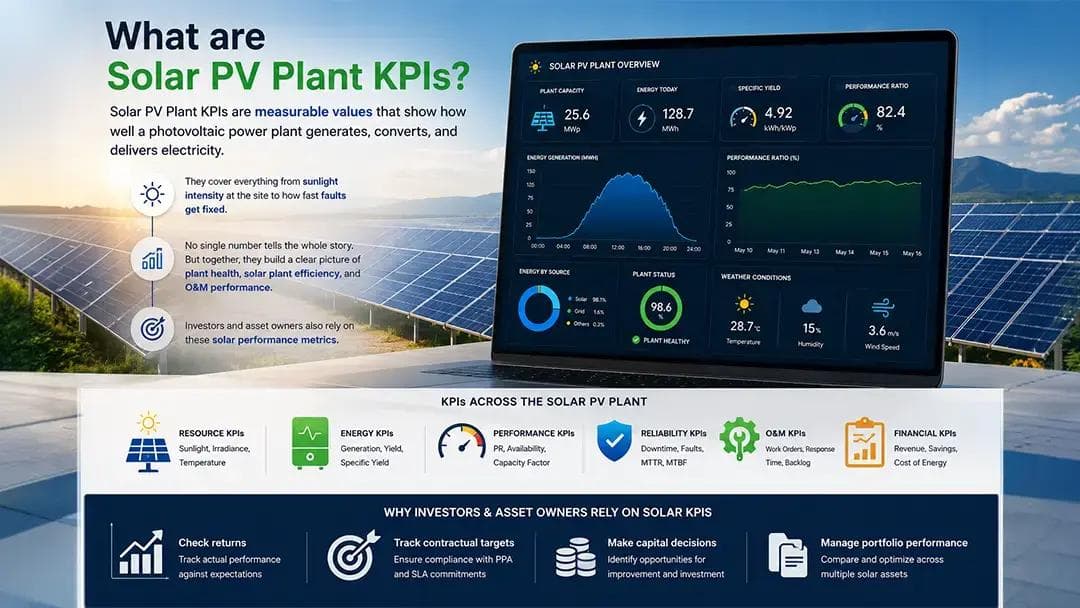
Solar PV Plant KPIs are measurable values that show how well a photovoltaic power plant generates, converts, and delivers electricity.
They cover everything from sunlight intensity at the site to how fast faults get fixed. No single number tells the whole story. But together, they build a clear picture of plant health, solar plant efficiency, and O&M performance.
Investors and asset owners also rely on these solar performance metrics. They use them to check returns, track contractual targets, and make capital decisions across their solar portfolio.
Solar Plant KPIs, Quick View
- Track the right solar KPIs to improve visibility, reduce downtime, control losses, and protect long-term plant performance.
Solar Plant KPIs at a Glance
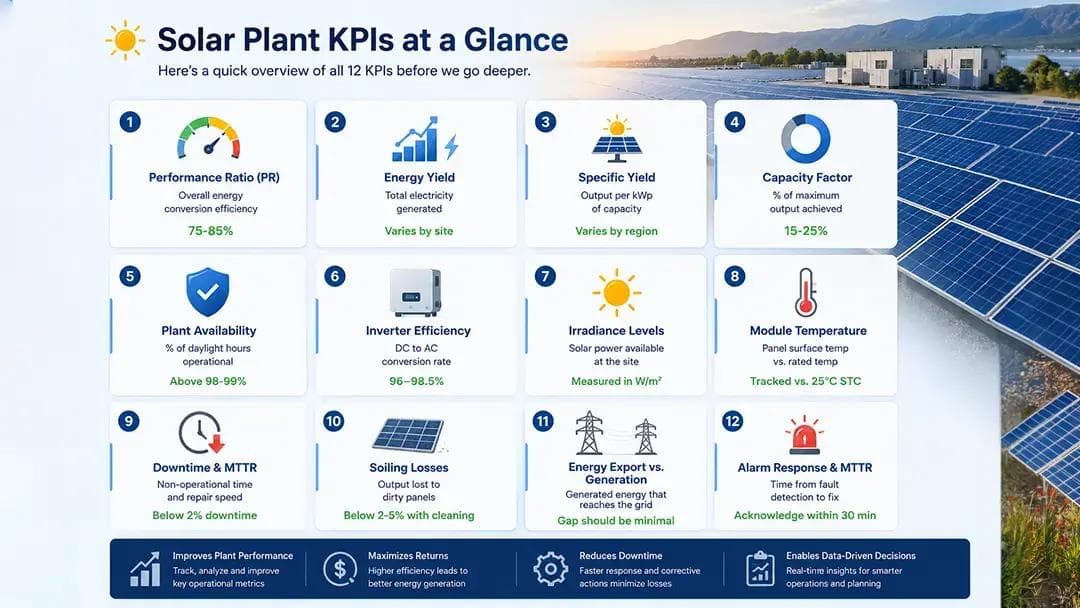
Here's a quick overview of all 12 KPIs before we go deeper.
| 1 | Performance Ratio (PR) | Overall energy conversion efficiency | 75-85% |
|---|---|---|---|
| 2 | Energy Yield | Total electricity generated | Varies by site |
| 3 | Specific Yield | Output per kWp of capacity | Varies by region |
| 4 | Capacity Factor | % of maximum output achieved | 15-25% |
| 5 | Plant Availability | % of daylight hours operational | Above 98-99% |
| 6 | Inverter Efficiency | DC to AC conversion rate | 96–98.5% |
| 7 | Irradiance Levels | Solar power available at the site | Measured in W/m² |
| 8 | Module Temperature | Panel surface temp vs. rated temp | Tracked vs. 25°C STC |
| 9 | Downtime & MTTR | Non-operational time and repair speed | Below 2% downtime |
| 10 | Soiling Losses | Output lost to dirty panels | Below 2-5% with cleaning |
| 11 | Energy Export vs. Generation | Generated energy that reaches the grid | Gap should be minimal |
| 12 | Alarm Response & MTTR | Time from fault detection to fix | Acknowledge within 30 min |
Now let's go through each one.
1. Performance Ratio (PR)
The performance ratio is the most important number in solar plant monitoring.
It shows how efficiently a plant turns available solar energy into usable electricity. It accounts for every real-world loss of heat, wiring resistance, inverter inefficiency, soiling, and downtime.
Formula:
PR (%) = (Actual Energy Output ÷ Theoretical Energy Output) × 100
A PR of 80% means 80% of available solar irradiance becomes electricity. The remaining 20% was lost somewhere in the system.
What the numbers mean:
| 75-85% | The plant is performing as expected |
|---|---|
| Above 85% | Excellent, above industry average |
| Below 70% | Serious issue investigates immediately |
Performance Ratio is the first number investors and asset managers look at. It's the most complete measure of overall solar PV plant performance. It's also technology neutral. That makes it easy to benchmark across plants of any size or location.
2. Energy Yield
Energy yield is the total output from solar PV power generation over a set period. It's measured in kWh or MWh per month or year.
Formula:
Energy Yield = Output Power (kW) × Time (hours)
This is the simplest way to check if your plant is producing what it should. Solar energy monitoring platforms track it in real time. If daily output drops below the expected level, the system flags it right away. Same-day visibility, no end-of-month surprises.
Energy yield connects directly to revenue, grid export records, and regulatory reporting. It's the first number most operators check every morning.
3. Specific Yield
Specific yield removes the size factor from performance comparison. It measures output per kilowatt-peak (kWp) of installed capacity.
Formula:
Specific Yield (kWh/kWp) = Total Energy Output ÷ Installed Peak Capacity
Example: A 500 kWp plant generating 800,000 kWh per year has a specific yield of 1,600 kWh/kWp.
This is one of the most useful solar plants KPIs for portfolio managers. Two PV plants in different regions may have very different total outputs. But if both are healthy, their specific yields should be similar. A consistent gap between them points to an underperforming site that needs attention.
4. Capacity Factor
The Capacity Factor shows what percentage of the maximum possible output the plant actually achieved.
Formula:
CF (%) = (Actual Energy Output ÷ Maximum Possible Output) × 100
Where: Maximum Possible Output = Plant Capacity (kW) × Total Hours in the Period
Solar plants typically achieve 15% to 25%. That's completely normal; the sun doesn't shine all day.
Among solar monitoring KPIs, the Capacity Factor is most useful in comparison. If your plant consistently falls below the regional average, it's worth checking for shading, soiling, or equipment issues.
5. Plant Availability
Plant availability measures how many daylight hours the plant was ready to generate energy.
Target: Most O&M contracts require 98% or above. Falling short can trigger penalty clauses with asset owners or offtakers.
Unplanned downtime cuts output directly. Inverter trips, protection faults, and grid disconnections are the usual causes. Solar plant monitoring systems track availability in real time. They alert O&M teams the moment a plant goes offline.
Grid availability matters here, too. If the utility grid goes down, even a healthy photovoltaic plant can't export energy. That counts as downtime in most contracts. Tracking both plant-side and grid availability gives operators the full picture.
High availability is one of the strongest predictors of total annual energy yield.
6. Inverter Efficiency
Inverters convert DC power from solar panels into AC power for the grid. Inverter efficiency measures how well they do that job under real conditions.
Typical range: 96% to 98.5% for modern string and central inverters. This figure drops as inverters age or runs in high ambient temperatures.
At a large scale, a 2% drop across multiple inverters means significant energy loss every year. Tracking inverter efficiency as a solar monitoring KPI helps catch problems early. It also helps operators plan replacement and refurbishment timelines. It's the most direct link between equipment health and plant revenue.
7. Irradiance Levels
Irradiance is the solar power available at the plant site. It's measured in W/m². Operators can't control it, but they must measure it accurately.
Without irradiance data, you can't calculate the performance ratio. You also can't tell if low output is from bad weather or a faulty inverter. Those two problems need completely different responses.
Most solar photovoltaic power plants install a dedicated weather station for solar PV plant monitoring. This typically includes pyranometers and temperature sensors that log irradiance data continuously.
Solar monitoring dashboards then overlay that data with energy generation output. Operators can instantly see if the plant is keeping pace with available sunlight. Without this layer, every performance dip requires a manual investigation.
Irradiance is the baseline that gives every other solar performance metric its meaning.
8. Module Temperature
Solar panels lose efficiency when they get hot. It's predictable and measurable but regularly underestimated.
Most crystalline silicon modules lose 0.3% to 0.5% efficiency for every 1°C above 25°C. That's the Standard Test Condition (STC) temperature.
Here's what that looks like in practice:
On a hot summer afternoon, panels can reach 60°C to 75°C. At 65°C, a 400W panel may only produce 320W to 340W. That's a 15–20% output loss with nothing broken.
Tracking module temperature as a solar plant KPI helps in three ways:
- It shows exactly how much output is being lost to heat.
- It lets operators compare real output against temperature-corrected targets.
- It improves design decisions for new solar photovoltaic power plant projects, such as mounting height, row spacing, and module type.
9. Downtime and Fault Events
Downtime is the total time a plant or component is non-operational. Fault events are the individual causes of inverter trips, communication failures, protection activations, or grid disconnections.
The key related metric is MTTR (Mean Time to Repair), the average time from fault detection to full restoration.
Formula:
MTTR = Total Downtime ÷ Number of Fault Events
Frequent faults with slow repair times create two clear problems:
- Energy generation drops
- O&M costs rise through emergency dispatch
When the same component keeps faulting, it usually points to a deeper reliability issue.
Downtime and fault event data are the core solar O&M metrics that separate well-run plants from reactive ones. Tracked consistently, this data builds the foundation for a proper predictive maintenance program where problems are caught early instead of discovered after the damage is done.
10. Soiling Losses
Soiling is the buildup of dust, bird droppings, pollen, or pollution on solar panel surfaces. It blocks sunlight from reaching the cells with no equipment failure involved.
How soiling loss is measured:
Compare the output of a clean reference module against a field module under the same irradiance conditions.
In dusty or dry environments near farmland, desert areas, or industrial zones, soiling losses can reach 5% to 15% without regular cleaning. For a large photovoltaic power station, that's real revenue gone every single month.
Operators who track soiling losses can switch from fixed cleaning schedules to condition-based cleaning.
The benefits are straightforward:
- Less water used per clean
- Lower labor costs overall
- Better energy yield protection
This is one of the clearest examples of how solar monitoring data translates directly into cost savings.
11. Energy Export vs. Generation
This KPI compares total energy generated by the plant against energy exported to the grid or consumed on-site.
The gap between the two equals auxiliary consumption plus internal AC losses. This covers transformer losses, cabling losses, and similar inefficiencies in the plant's electrical infrastructure.
If generation looks fine but export is consistently lower, these are the usual suspects:
| Transformer inefficiency | Transformer age and load profile |
|---|---|
| Metering discrepancies | Meter calibration and export logs |
| Rising auxiliary consumption | Cooling systems and SCADA loads |
| Intermittent grid availability | Utility disconnection and curtailment records |
For a large PV power station, even a 1% persistent gap between generation and export adds to a major revenue loss across a contract year.
Every unit that doesn't reach the export meter is a unit that doesn't get paid for.
12. Alarm Response Time and MTTR
Alarm Response Time measures how quickly the operations team acknowledges a fault. MTTR measures how fast it gets fully resolved.
Industry benchmarks:
| Fault acknowledgment | Within 15-30 minutes |
|---|---|
| Full resolution (critical faults) | Within 4-8 hours |
A 4-hour inverter outage during peak irradiance means lost generation that can never be recovered. Across a full year, slow alarm response adds up to a measurable drop in output. Most operators are surprised by the size of that number when they calculate it.
This KPI also helps O&M managers spot process gaps and training issues. It helps them decide if remote diagnostics or additional field staffing is worth the investment.
Plants with strong alarm response records consistently show better long-term availability and better solar asset performance scores overall.
Solar Plant KPIs in a Nutshell
- These KPIs show how much energy your plant generates, where losses happen, and which issues need faster action from O&M teams daily.
How Solar Plant Monitoring Systems Help Track These KPIs
Tracking 12 KPIs across dozens of inverters, meters, sensors, and weather stations manually isn't possible at any real scale.
That's where solar plant monitoring systems come in.
A well-designed solar monitoring dashboard pulls data from every plant component in real time. It calculates Performance Ratio, specific yield, Availability, and other metrics automatically.
When any KPI falls outside the expected limits, it sends an alert. O&M teams don't need to check dashboards every hour. The system tells them what needs attention and where.
More advanced IoT-connected platforms go further. They enable predictive maintenance by detecting early degradation signals weeks or months before a failure.
Maintenance gets scheduled during low-irradiance windows. That shifts teams from reactive firefighting to planned, cost-efficient work.
These platforms also give portfolio managers a single, unified view of O&M performance across every site.
Photovoltaic power generation output, solar plant efficiency trends, and asset health are all visible in one place. Whether you're managing one solar photovoltaic power station or 50 sites across a region, robust solar plant analytics makes the difference between guessing and knowing.
Plants that consistently generate the best returns almost always have the strongest data infrastructure behind them.
Conclusion
Solar PV Plant KPIs are not just performance reports. They are operational tools that directly affect plant profitability.
From Performance Ratio and Energy Yield to Soiling Losses and Alarm Response Time, each metric tells you something the others don't. Used together, they give operators a complete view of where the plant is healthy and where it's quietly losing energy and money every day.
The plants that consistently outperform don't wait for problems to become visible. They track the right solar performance metrics. They act early. And they use data to drive solar plant efficiency every single day, not just during quarterly reviews.
If you're running a photovoltaic power plant without a structured KPI monitoring system in place, that's the most important gap to close. The data you don't collect today is the performance you can't recover tomorrow.
Track Solar Plant KPIs Without Manual Effort
Get real-time visibility into PR, energy yield, Availability, alarms, and downtime from one smart dashboard.