If you manage more than one solar site, you already know the drill.
One tab for Site A's inverter portal. Another for Site B. A spreadsheet somewhere trying to hold it all together, updated by hand, usually a day or two behind reality.
It works. Right up until it doesn't.
Most solar operators don't set out to build this system. It grows one site at a time. You add a second plant, then a third. Before long, you're logging into five different manufacturer portals just to answer one simple question: which sites are underperforming this week?
This is the point where spreadsheets stop being shortcuts. They become bottlenecks.
This guide covers why that happens, what centralized monitoring looks like in practice, and how to evaluate a platform without getting lost in vendor jargon.
Why Spreadsheets Break Down at Scale

A spreadsheet works fine for one site. You check the inverter app once a day, jot down the numbers, and move on.
The trouble starts when you're doing that same routine across five, ten, or twenty sites. Each one has its own login. Its own dashboard layout. Its own quirks.
A few things go wrong almost immediately.
The data is always a little stale
Someone must manually pull numbers from each portal and paste them into the tracker. That takes time. And time means the spreadsheet reflects yesterday's performance, not today's. If an inverter goes offline at 10 a.m., nobody notices until the next manual check.
Copy-paste errors creep in
Wrong row, wrong site, a decimal point in the wrong place. Nobody catches these until a monthly report doesn't add up. By then, it's hard to trace where the error came from.
There's no real alerting
Spreadsheets don’t ping you when a site's output drops below expected levels. You find out when you happen to look. That means underperformance can run for days before anyone notices the dip in revenue.
Nobody has one view of the whole portfolio
Ask a spreadsheet-based operator which three sites are dragging down this month's numbers. You'll usually get a pause while they open five browser tabs to check. That question should take ten seconds to answer, not ten minutes.
Onboarding gets harder too. Every time someone new joins the team, they have to learn which tab maps to which site, which login belongs to which contract, and which color-coding system the last person invented. That knowledge usually lives in one person's head, not in any document. When that person leaves or goes on leave, the whole system gets shakier for weeks.
None of this is a knock on anyone's process. It's just what happens when a tool built for one site gets stretched across many.
The fix isn't a better spreadsheet template. It's removing the manual steps altogether.
Quick Take
- Managing several solar sites through spreadsheets means stale data and missed faults. A centralized dashboard replaces manual tracking with real-time, automated monitoring.
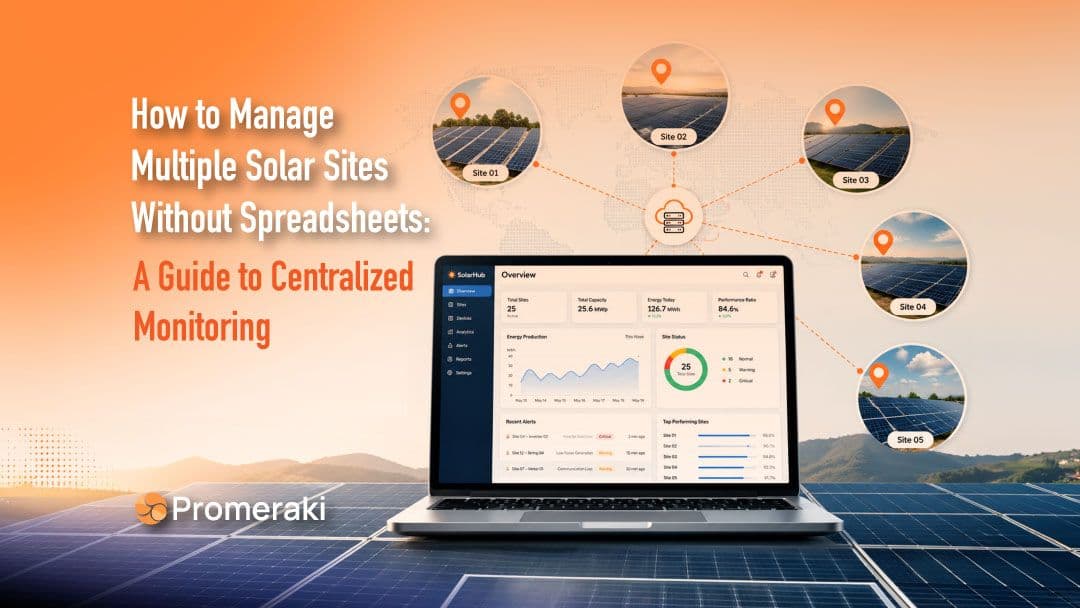
What Centralized Solar Monitoring Replaces
A centralized solar monitoring dashboard does one simple thing. It pulls data from every site, regardless of inverter brand or hardware, into a single screen.
Instead of logging into five portals, you log into one.
Here's the practical difference between the two workflows.
Spreadsheet workflow:
- Log into each site's portal separately
- Manually record output, faults, and alerts
- Update the spreadsheet by hand, once a day or once a week
- Notice problems only when someone happens to check
- Build reports manually before every stakeholder meeting
Dashboard workflow:
- One login, all sites visible at once
- Data updates automatically, often in near real time
- Alerts trigger the moment something looks off
- Reports generate on a schedule; no manual assembly required
- Anyone on the team can check portfolio health in under a minute
This shift isn't about replacing human judgments. Someone still needs to decide what to do about an underperforming site.
What changes is how fast that person finds out there's a problem and how much time they get back by not chasing numbers across browser tabs.
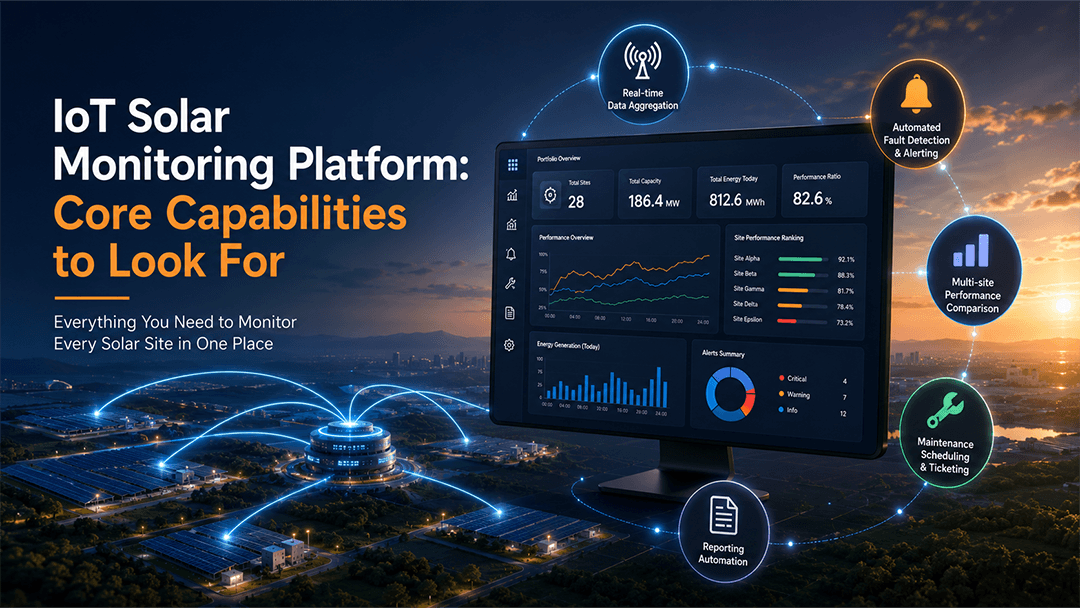
IoT Solar Monitoring Platform: Core Capabilities to Look For
Not every monitoring tool does this well. Some are barely better than the manufacturer's own app, just with a different logo.
Here's what matters when you're managing more than one site.
Real-time data aggregation across hardware brands
Most solar portfolios end up with mixed equipment over time, especially if sites were installed by different contractors or in different years. A monitoring platform needs to pull data from all of it, not just one inverter brand. If your tool only works with a single manufacturer, you'll hit a wall the moment your next site uses different equipment.
Automated fault detection and alerting
This is the single biggest upgrade over spreadsheets. Instead of discovering a problem during a manual check, the system flags it the moment output drops or a device goes offline. Good platforms let you set thresholds, so you're not drowning in false alarms either.
Multi-site performance comparison
You should be able to see all your sites side by side, ranked by output, uptime, or whatever metric matters most that week. This turns "which site needs attention" from a research project into a glance.
Maintenance scheduling and ticketing
For teams running solar O&M software for multiple sites, this matters as much as monitoring itself. When a fault triggers, does the platform just show you a red dot? Or does it help you assign a technician and track the fix through to close-out?
Reporting automation
Stakeholder updates, compliance reports, and monthly performance summaries. These should generate a schedule, not get built by hand the night before a meeting. The best platforms let you customize what each report shows, since an investor update and an internal maintenance report usually need different information.
A platform missing more than one of these is just a fancier version of the spreadsheet problem.
And more features aren't automatically better. A dashboard stuffed with widgets nobody uses is its own kind of clutter. The goal is coverage of these five areas done well, not a longer feature list for its own sake.
Choosing a Multi-Site Solar Monitoring Solution
Once you've decided to move off spreadsheets, the harder question is picking up the right tool. Here's a short checklist to work through before you commit to anything.
Does it scale with your portfolio? A tool that works fine for five sites might slow down or get clunky at fifty. Ask vendors how their platform performs at the scale you expect to reach in two or three years, not just where you are today. Ask for a reference customer who has grown their portfolio on the platform, not just a case study written at launch.
Is it hardware-agnostic? If you're locked into monitoring only one inverter brand, you've just built a smaller version of the same problem. Confirm the platform supports the equipment you already have and whatever you're likely to add next. This matters more than it seems if you work with multiple installers or acquire sites built by someone else.
Does it integrate with what you already use? CRM, billing, or reporting tools your team relies on shouldn't need to be abandoned just because you added a monitoring dashboard. Check for existing integrations or at least an open API.
Is it usable by non-technical stakeholders? Engineers might be comfortable digging through raw performance data. Investors, clients, or non-technical managers usually just want a clean summary. A platform that only speaks to one audience ends up needing a workaround for the other, and that workaround is often, ironically, a spreadsheet.
What does support look like? Onboarding, training, and response time when something breaks matter more than they seem to at signup. Ask for real examples of how the vendor has handled downtime or data issues for other customers. Find out whether support is a dedicated person or a generic ticket queue.
Answering these five questions honestly rules out most of the wrong-fit options before you waste time on a demo that doesn't match your needs.
Signs You've Outgrown Spreadsheet-Based Monitoring
Not sure if you're at that point yet? A few signals tend to show up before the switch becomes obvious.
- You've missed a fault because nobody checked in time. If a site went offline or underperformed for more than a day before anyone noticed, that's not bad luck. That's the system.
- One person holds the whole process together. If your entire monitoring routine depends on one person's memory, login list, or morning habit, you don’t have a system. You have a single point of failure.
- Reporting takes longer than it should. If pulling together a monthly performance summary eats half a day, that's time your team isn't spending on anything that improves output.
- You've added a site and felt the friction immediately. Going from three sites to four shouldn’t feel like a big lift. If it does, the current process wasn't built to scale in the first place.
- You're more confident in gut feeling than the numbers. When the data is a day or two old and scattered across five tabs, people start trusting instinct over the tracker. That's a sign that the tracker has stopped doing its job.
If two or more of these sound familiar, the spreadsheet isn't saving time anymore. It's just hiding how much time is already being lost.
Final Thoughts
Spreadsheets aren't a bad tool. They're just the wrong tool once your solar portfolio grows past a site or two.
The manual work that felt manageable at one site becomes a real drag on time and revenue once you're juggling five, ten, or more.
A centralized monitoring dashboard doesn't just save time. It catches the problems that spreadsheets miss, the ones that cost money while nobody's looking.
If you're still stitching together portfolio visibility by hand, it might be worth seeing what a unified view looks like. That's exactly what Promeraki helps solar operators achieve.