Connected devices generate massive amounts of data every second. Many companies believe that if they can see this data through an IoT monitoring dashboard, they have control over their systems. This belief influenced the design of early IoT systems.
Today, many OEM founders are realizing something important. Visibility is not the same as control. Dashboards help teams see what is happening, but they rarely help teams decide what to do next or prevent issues before they happen.
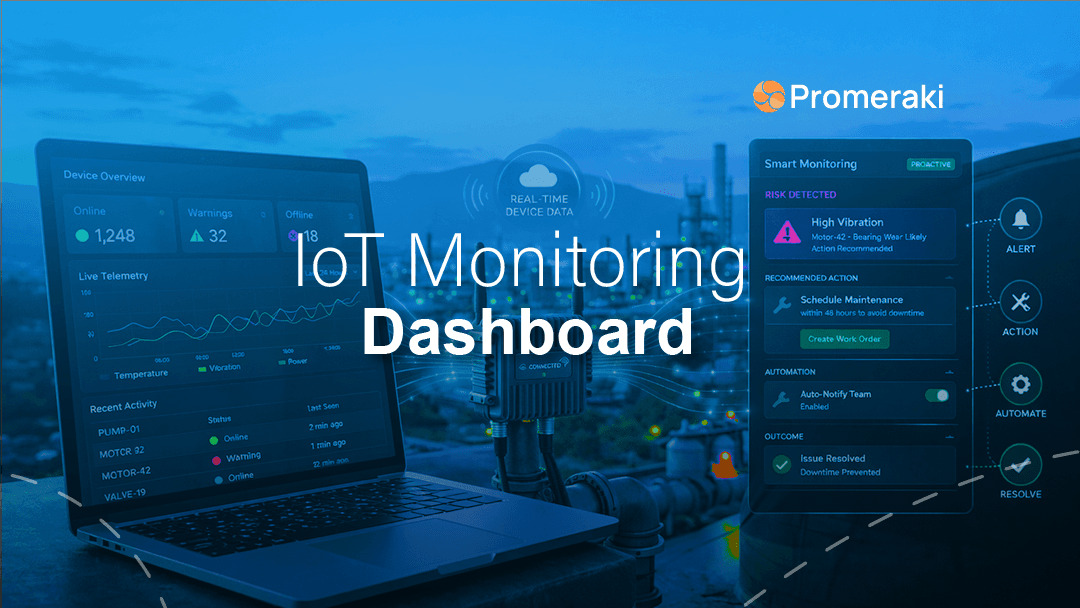
Modern IoT monitoring systems are shifting toward decision support. Instead of only showing data, they help teams detect risks, prioritize problems, and trigger actions automatically. This shift is transforming how connected products are designed and managed.
In this blog, we explore why dashboards became dominant, where they work well, where they fail, and what effective IoT monitoring actually looks like in modern connected systems.
What Is IoT Monitoring?
IoT monitoring is the process of continuously analyzing connected device data to detect issues early, prioritize risks, and trigger automated or guided actions.
Dashboards inform. Monitoring systems decide.
Visibility reports. Monitoring prevents.
This shift defines the difference between basic connected products and mature, scalable IoT platforms.
The Dashboard Obsession in IoT
Dashboards became the default monitoring tool because they deliver fast visual value. When early IoT products launched, success was measured by one simple idea. If teams could see device data in real time, the system was considered successful.
This created the “If we can see it, we control it” mindset.
Dashboards also appeal strongly to founders and executives. They look powerful. They show live numbers. They make systems feel transparent and manageable. For early deployments, this approach works.
But as device fleets grow, teams start to notice gaps. They can see data, but they cannot always prevent failures, prioritize risks, or automate responses.
What IoT Dashboards Do Well
IoT dashboards still play an important role in connected systems. They are not useless. They simply solve only part of the monitoring problem.
Centralized Data Visibility
Dashboards provide a single place to view device health, connectivity, and performance metrics. This is useful for operations teams and leadership reviews.
According to Splunk’s IoT monitoring overview, centralized data visibility helps organizations detect system anomalies and maintain operational awareness across distributed device fleets.
Reporting and Compliance
Many industries require device performance reporting. Dashboards make it easier to generate reports for audits, compliance checks, and customer reporting.
Trend Visualization
Dashboards help teams track performance trends over time. This supports capacity planning, product improvements, and usage analysis.
Executive-Level Summaries
Dashboards help leadership teams quickly understand system performance without technical deep dives.
These strengths explain why dashboards became standard across IoT deployments.
Where Dashboards Fall Short
As systems scale, dashboard limitations become more visible.
Dashboards Are Reactive
Dashboards usually show what already happened. They rarely predict what will happen next. This forces teams to respond after problems impact customers.
Research and industry monitoring studies show that many IoT failures are detected only after performance drops or outages occur because systems rely on reactive monitoring patterns.
Dashboards Do Not Prioritize
Large deployments generate huge volumes of alerts. Many dashboards treat all alerts equally. Teams see 50 alerts but do not know which five matter most.
Without severity modeling and context awareness, teams waste time investigating low-risk issues while critical risks grow.
Dashboards Do Not Trigger Action
Dashboards require humans to interpret data and decide next steps. This creates decision bottlenecks. Response time increases. Operational risk grows.
This is where the debate around dashboard vs automation in IoT becomes critical.
Seeing Data vs Understanding Data vs Acting on Data
This is the most important evolution in IoT monitoring.
Seeing Data
This is raw visibility. Teams see metrics, alerts, and device status. This is where dashboards are strongest.
Understanding Data
This adds context. Systems analyze patterns, compare behavior to baselines, and detect anomalies. This reduces noise and improves signal clarity.
This is where IoT decision support systems begin to operate.
Acting on Data
This is where real control exists. Systems trigger workflows, automate responses, or guide human decisions using structured logic.
This is the foundation of outcome-driven IoT monitoring.
What it really means:
- Visibility tells you what's happening. Control lets you do something about it. Most dashboards only give you visibility - but smart monitoring systems give you both.
What Effective IoT Monitoring Actually Looks Like
Modern monitoring focuses on enabling decisions and actions.
Context-Aware Monitoring
Systems understand device behavior patterns. They detect abnormal behavior early instead of waiting for failures.
Event Prioritization
Systems rank alerts based on severity, business impact, and device criticality. Teams focus on what matters most.
Automated Responses
Monitoring systems trigger actions automatically. They restart services, adjust device settings, or escalate incidents.
Workflow Integration
Monitoring integrates with support tools, ticketing systems, and business workflows.
This is where monitoring becomes a decision-support infrastructure instead of just visualization.
Organizations building modern IoT monitoring systems are focusing on automation-first architectures instead of dashboard-first designs.
Monitoring as Part of a Larger System
Monitoring cannot operate in isolation. It must connect to intelligence layers and automation layers.
Modern IoT architecture follows this flow:
Monitoring -> Intelligence -> Automation -> Outcome
Dashboards remain useful, but only as an interface. They are not the system itself.
OEMs that embed decision logic directly into platforms achieve better uptime, faster response, and lower support costs.
Industry comparisons between modern IoT monitoring and traditional dashboard systems show that automation-driven monitoring significantly improves operational response time.
Why This Shift Matters for OEM Founders
IoT adoption continues to accelerate across industries.
The global IoT market is expected to grow from about $1.02 trillion in 2024 to nearly $3.49 trillion by 2033 as digital operations expand.
At the same time, connected device volume continues rising toward tens of billions globally.
At this scale, manual monitoring cannot keep up. Decision-driven monitoring becomes mandatory.
Companies investing in an IoT monitoring strategy early are better prepared for scale, automation, and reliability.
Stop monitoring. Start controlling.
Our IoT platforms moves your team from reactive dashboards to proactive, automated device management - giving you real control over every connected device in your fleet.
Final Thought
Dashboards helped IoT grow. They improved visibility and simplified early monitoring.
But visibility alone does not prevent failures. It does not reduce operational complexity. It does not scale with device growth.
Modern IoT monitoring is about operational intelligence. It enables faster, better decisions.
Effective monitoring is about enabling faster, better decisions, not just better dashboards.
Companies that build monitoring systems around decision support, automation, and context awareness create more reliable products and stronger business outcomes.